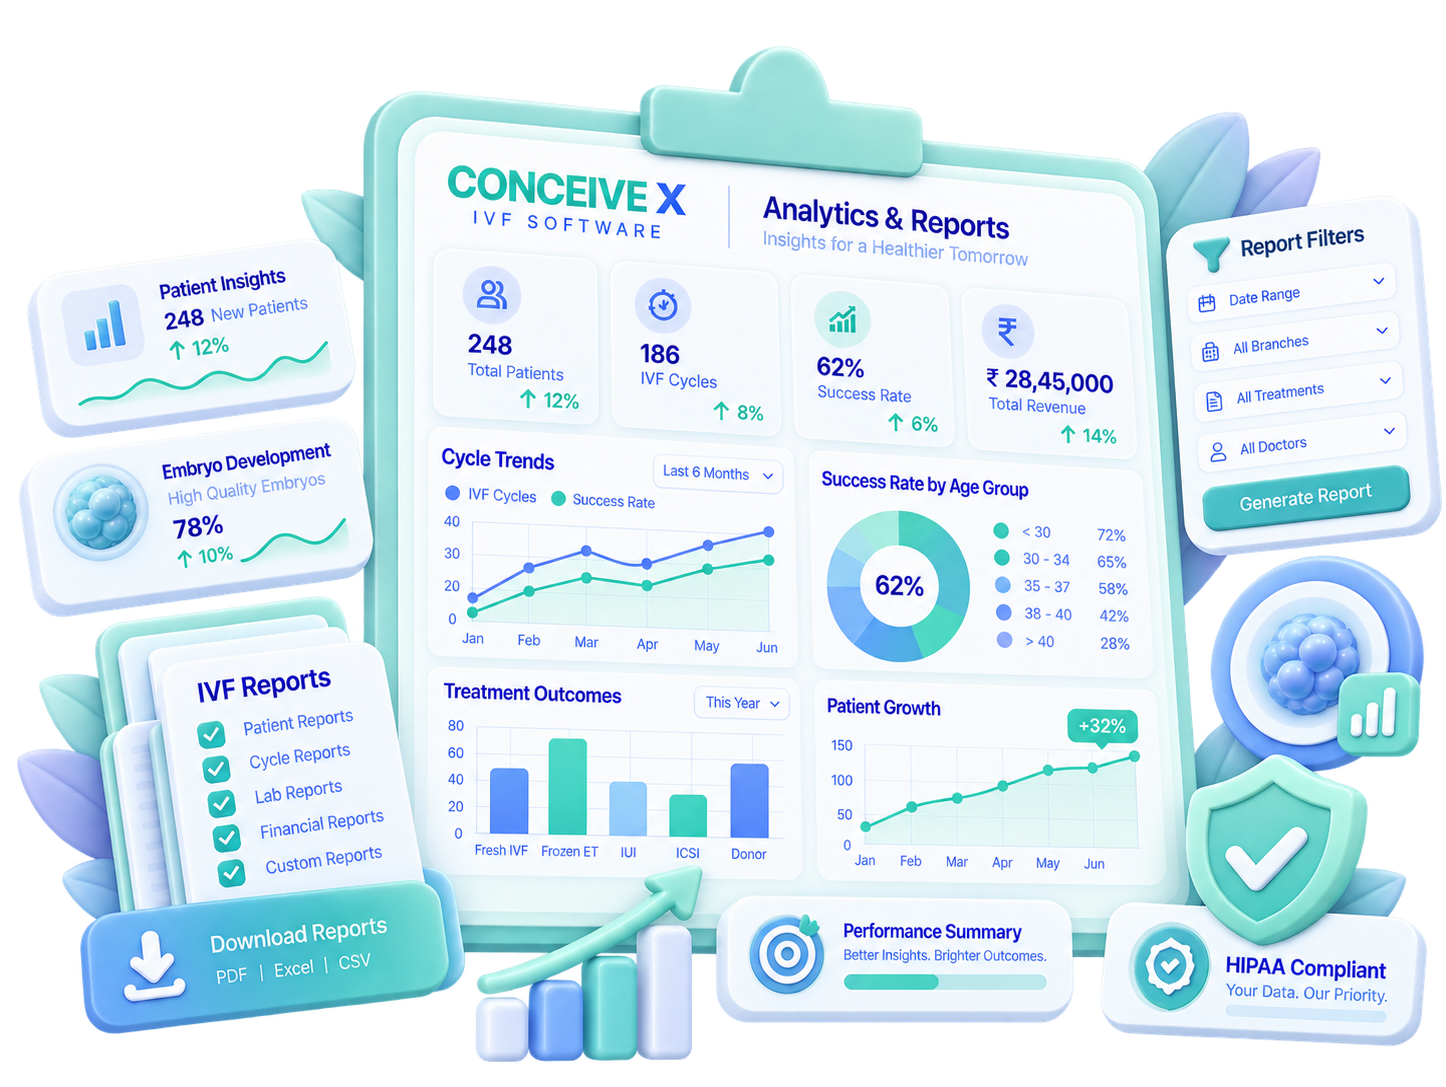
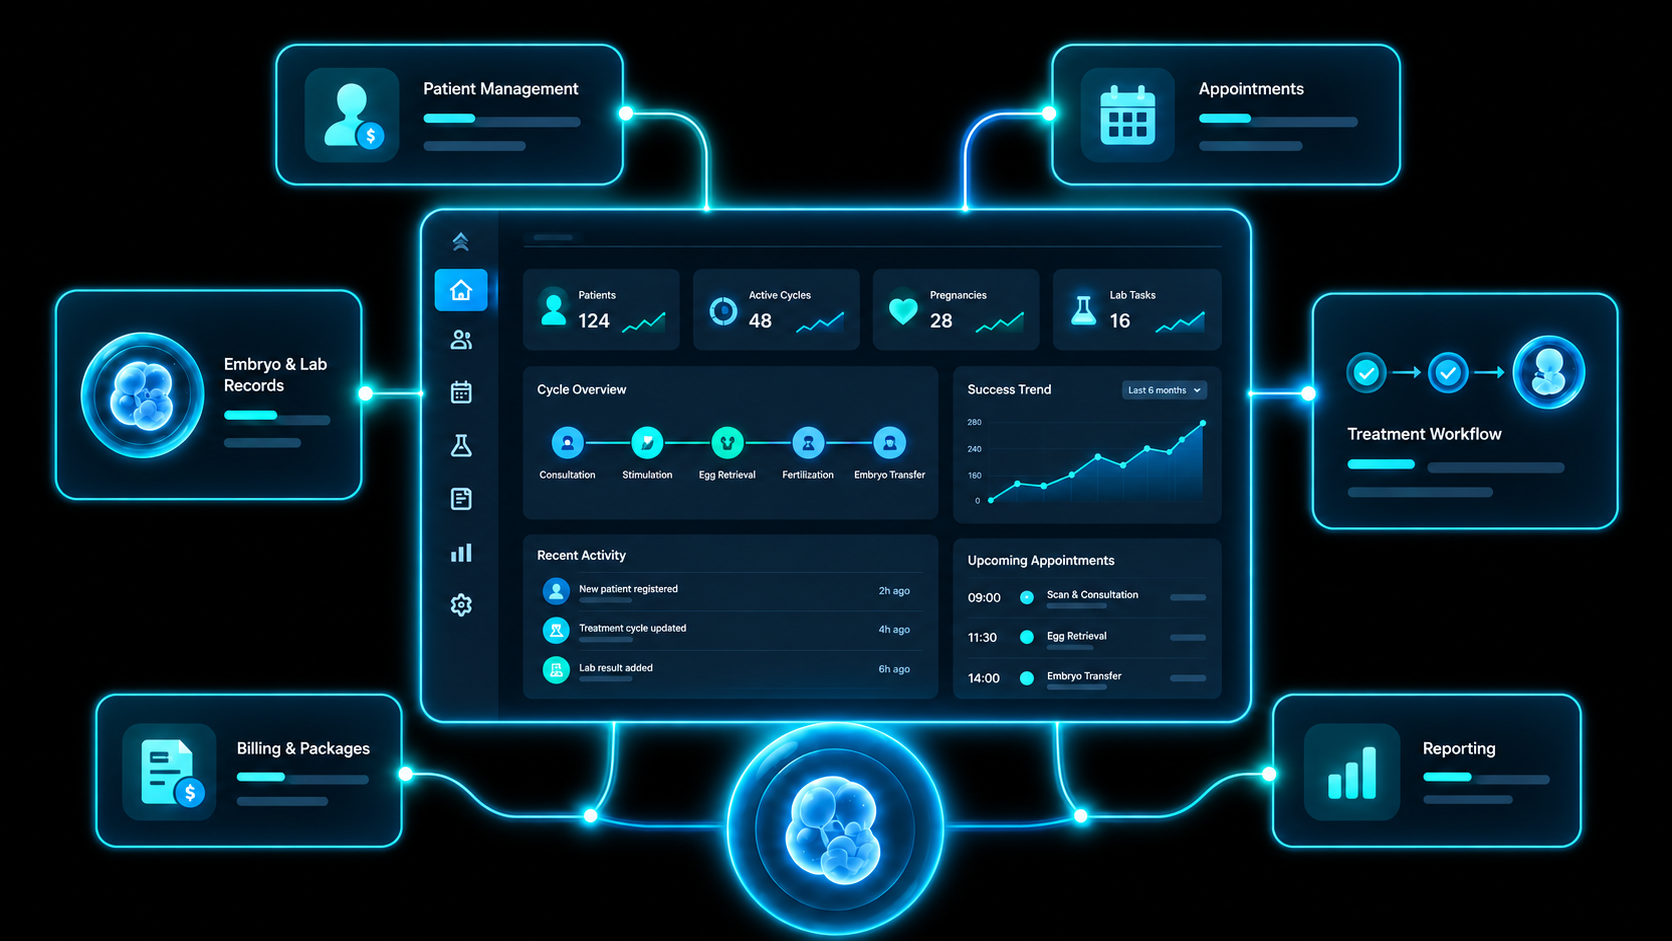
ConceiveX IVF analytics calculates clinical pregnancy and live-birth rates live from every tracked cycle, by age band, protocol, doctor and lab, with clinic KPIs and ICMR, National ART Registry and ART Act reports ready in one click.
Every Report Your Clinic Files, Built from Live Data
Month-end spreadsheets show a number. They cannot show why it moved. ConceiveX Analytics & Reports reads every dashboard figure, success rate and registry file straight from tracked cycles, so any report drills down to the age band, protocol, doctor and lab result behind it.
01
Clinic KPI Dashboard
One screen for cycles started, cancellation rate, clinical pregnancy rate, embryos frozen and collections, filtered by day, month, quarter or branch.
This quarter · 412 cycles · CPR 48%
02
Success-Rate Reports
Clinical pregnancy, ongoing pregnancy and live-birth rates per age band, protocol and cycle type, per transfer or per cycle started, with national benchmarks alongside.
35–37 · ICSI · 44% CPR
03
Doctor & Embryologist Scorecards
Outcome tables per fertility specialist and embryologist. Pregnancy and cancellation rates, fertilisation, blastocyst and thaw-survival rates, with outliers flagged.
Dr. Mehta · 52% · 86 cycles
04
ICMR, NARI & ART Act Reports
Registry uploads, ICMR formats and ART Act registers filled from tracked cycles, validated before submission, exported in one click.
NARI · Sep · 118 cycles · 0 errors
05
Conversion & Drop-Off Reports
Enquiry to consult, consult to cycle, cycle to transfer, transfer to pregnancy. Conversion at each stage, per counsellor and per source.
Consult to cycle · 61%
06
Scheduled Reports & Exports
Daily, weekly and monthly report packs sent to the director on WhatsApp or email, plus Excel, PDF and data-feed exports of any dashboard view.
Monday 07:00 · 6 reports
Six report families, one data source. Every figure traces back to the IVF cycles it was calculated from.
Cycles started, cancellation rate, clinical pregnancy rate and collections for any branch and period, read live from tracked cycles rather than a month-end spreadsheet. Switch from month to quarter and every KPI tile, trend line and cycle-mix chart recalculates. The same view goes to the director as a PDF in one click.
KPI tiles with month-on-month deltas and targets, per branch or the whole network
Trend charts against the same period last year, with cycle mix by IUI, IVF, ICSI and FET
Drill from any figure to the list of cycles it was calculated from
app.conceivexsoftware.in · Clinic KPIsLIVE
Dashboard emailed to Dr. Kulkarni · PDFJul 2026 · 72 cycles▲ 12 vs Jul 2025 · 34 ICSI · 20 IVF
Clinic KPIs · Aarambh Fertility
All branches · This month
This monthQuarterFY 26–27
Cycles started
,
,
Clinical pregnancy
,
,
Cancellation
,
,
Collections
,
,
Cycles started per month
vs last year – –
Cycle mix
0CYCLES
ICSI46%IVF28%FET18%IUI8%
Share with director
Success-rate reports
Success-Rate Reports That Show Their n
Clinical pregnancy, ongoing pregnancy and live-birth rates per age band, protocol and cycle type, charted against national benchmarks. Filter to one protocol and the bars re-settle. Hover a band to see the transfers behind it and the 95% confidence interval, so a small-n spike never reaches the website.
Break down by age band, protocol, cycle type, doctor and branch, with cycle counts and 95% confidence intervals on every bar
Benchmark lines from ICMR and international registries, refreshed yearly
Denominator selectable. Per started cycle, per retrieval or per transfer, to match how you publish
app.conceivexsoftware.in · Success ratesLIVE
Filtered · Antagonist · 2025–26 · 286 cycles
35–37 · 44% CPR n = 96 transfers · 95% confidence interval 34–54% +4 pts vs national
Clinical pregnancy rate by age band
Per embryo transfer · All protocols · 412 cycles
AllAntagonistLong agonist
AarambhNational benchmark
20%40%60%
0%<30
0%30–34
0%35–37
0%38–40
0%Over 40
Above benchmark · 5 of 5Over 40 · few cycles, wide interval
Live from 412 tracked cycles · updated 09:12
Doctor & embryologist scorecards
Performance Reports per Doctor and per Lab
A scorecard per fertility specialist with cycles, pregnancy and cancellation rates and six-month sparklines, beside the lab’s fertilisation, blastocyst and warming-survival rates against Vienna consensus benchmarks. Any rate outside the clinic range is flagged in the report and a case review is scheduled from it.
Report per doctor, per embryologist and per branch, case-mix adjusted by age band
Lab KPI report against Vienna consensus and your own targets, trended monthly
Export a case-review list for any flagged rate in one click
app.conceivexsoftware.in · PerformanceYTD
Dr. Shah · cancellation review scheduled · Fri 16:00
Per embryologist. Sneha 63% · Arjun 58% blastocyst rate
ICMR, National ART Registry & ART Act reports
Registry & Compliance Reports That Validate Before They Upload
The monthly National ART Registry file, the ICMR annual return and the ART Act registers are generated from the cycles you already tracked, nothing retyped. Each report runs its own validation, flags missing outcomes and consents before submission, and uploads with the acknowledgement kept on file.
NARI, ICMR and state-authority report formats maintained by ConceiveX as rules change
Pre-submission checks against the couple record. Consents, donor flags, outcomes and β-hCG dates
Scheduled report packs to the director on WhatsApp or email, with Excel, PDF and data-feed exports
Monday 07:00 · Dr. KulkarniClinic KPIs · PDF · Success rates · Excel Registry status · PDF · WhatsApp + email
Registry & compliance reports
Generated from tracked cycles · nothing retyped
Due 05 Oct
National ART Registry · monthly
NARI portal upload · Sep 2026 · 118 cycles
Generate
ICMR ART clinic return
Annual format · FY 25–26 · 1,462 cycles
Ready
ART Act Form 8 register
Consents & donor register · Q2 · PDF · 42 pp
Ready
Success rates · website disclosure
Per age band · per transfer · PDF · 2 pp
Ready
Scheduled · Monday 07:00 · director on WhatsApp & email6 reports
Validation
118 cycles matched to registry IDs
Outcomes recorded · 118 / 118
Donor cycles flagged · 9
2 missing β-hCG dates
NARI_Sep2026_Aarambh.xml
118 records · 0 KB · signed
ACK-2609-118 · filed 12:04
Upload to NARI portal
How it works
From Tracked IVF Cycle to Filed Report in Four Steps
01
IVF EMR & cycle tracking
Track
Every cycle, scan, lab result, transfer and outcome is recorded once in the EMR. Analytics reads it live, nothing is re-entered.
02
Analytics engine
Calculate
Clinical pregnancy, live-birth and lab rates are calculated per age band, protocol, doctor and embryologist, with cycle count, denominator and 95% confidence interval attached.
03
Quality & compliance
Validate
Outliers are flagged against Vienna consensus and clinic targets. Registry files check consents, donor flags and outcomes before submission.
04
Director & registries
Report
KPI dashboards refresh live, scheduled report packs reach the director on WhatsApp or email, and NARI, ICMR and ART Act reports upload in one click.
Connects toNational ART Registry (NARI)ICMR formatsPower BI & LookerExcel & Google SheetsTallyWhatsApp & emailIVF EMR & cycle trackingEmbryology lab module
Excel vs hospital MIS vs ConceiveX IVF analytics
Why Spreadsheets and Hospital MIS Cannot Produce IVF Reports
Excel & year-end tallies
Generic hospital MIS
ConceiveX IVF analytics
IVF success rates
One year-end figure, tallied by hand
Not calculated. MIS has no cycle concept
Live report per age band, protocol, doctor and cycle type
Cycle counts and confidence intervals
Neither cycle count nor denominator shown
Visit counts, not cycles or transfers
cycle count, denominator and 95% confidence interval printed on every rate
Doctor & lab scorecards
Compared informally, if at all
Revenue per doctor, no outcomes
Case-mix adjusted CPR per doctor. Lab KPIs vs Vienna consensus, outliers flagged
NARI, ICMR & ART Act reports
Weeks of collation before each deadline
Manual export, retyped into the portal
Generated, validated and uploaded from tracked cycles, acknowledgement on file
Drill-down from any figure
Open the register and search by hand
Static PDF, no drill-down
Click any rate to the list of cycles it was calculated from
Reports to the director
Spreadsheet emailed when asked
Monthly MIS pack, weeks late
Scheduled report packs on WhatsApp and email. Power BI and Excel live
IVF clinics on ConceiveX Analytics & Reports
Reports We Publish, Deadlines We No Longer Dread
“Success-rate reports
When a couple asks our pregnancy rate for 35 to 37, I open the age-band report and show them the figure with its n and confidence interval. Our website disclosure comes off the same report, so we never quote a number we cannot back.
Dr. Meera KulkarniDirector, Aarambh Fertility Centre, Pune“Lab KPI reports
The lab KPI report, blastocyst rate per embryologist trended against Vienna benchmarks, is on my screen every morning. A dip in one incubator was flagged in the report before anyone noticed at the bench.
Sneha IyerChief Embryologist, Genesis IVF Lab, Chennai“Registry & director reports
The National ART Registry file for seven centres used to take our compliance team three weeks. It now generates, validates and uploads itself on the 3rd, and the acknowledgement lands in my Monday report pack on WhatsApp.
Rahul MenonGroup CEO, Nurture IVF Network
Pricing
IVF Analytics & Reports Pricing for Every Clinic
Every plan includes the clinic KPI dashboard and standard report library. Live success-rate reports, registry generation and scheduled director report packs start at Growth. Historic cycles are migrated so every report has history from day one.
Save ₹200/mo annually
Starter
5–25 licences
KPI dashboard and standard report library for new and small IVF clinics
Prices are per licence for ConceiveX IVF software, including Analytics & Reports, and are final and non-negotiable to ensure fairness for every IVF clinic.
ConceiveX · Analytics & Reports Demo
See Your Clinic’s Reports Built Live from Your Cycles
A 20-minute walkthrough. The clinic KPI dashboard by branch, success-rate reports by age band and protocol with confidence intervals, doctor and lab scorecards, and the National ART Registry file generated, validated and uploaded.
Rated for live success-rate analytics and registry reporting by IVF directors, embryologists and compliance teams on every major software review platform.
5.0/5
SoftwareSuggest
User Most Likely to Recommend, Winter 2023
5.0/5
Slashdot
Verified user reviews
4.6/5
Capterra
Rated by IVF analytics users
4.8/5
Software Advice
Rated for IVF reporting
5.0/5
SourceForge
5-star user reviews
Before you ask
Questions About Analytics
Go-live+Can we bring in historic cycles so reports have history?
Yes. Past cycles, outcomes and dates import at go-live, so success-rate trends and registry reports start with your real history rather than from zero. See how clinics switched in the case studies.
Dashboards are live the day your records are in. Historic import and KPI targets are set in the first week, inside the 19-day median go-live. See how clinics switched in the case studies.
Go-live+Who sets our KPI targets and benchmark lines?
Your onboarding specialist loads clinic targets and the ICMR and international benchmark lines with you, and you can change them any time. See how clinics switched in the case studies.
Go-live+Can the director get the daily summary from day one?
Yes. The WhatsApp daily KPI summary starts the first live morning: cycles, collections, cancellations and pregnancies. See how clinics switched in the case studies.
Go-live+Do we need a data analyst to use the reports?
No. Forty standard reports and the dashboard need no setup. The custom report builder is for teams that want more. See how clinics switched in the case studies.
Go-live+Can report packs be scheduled before go-live?
Yes. Weekly and monthly packs are set up during onboarding so the first pack lands the first Monday you are live. See how clinics switched in the case studies.
Go-live+How do we validate the first registry report?
The specialist walks the first National ART Registry and ICMR export with you and checks every cycle is counted once. See how clinics switched in the case studies.
Data+Does it generate the National ART Registry, ICMR and ART Act reports?
Yes. Registry and ICMR submissions are generated from the cycles already recorded, validated and uploaded to the portal in one click. Report data is hosted in India and exportable any time; see data security.
Data+Can I export success-rate reports for the ICMR registry?
Yes. Live birth and clinical pregnancy by age band and protocol export in the registry format with the denominators included. Report data is hosted in India and exportable any time; see data security.
Data+How are success rates calculated in the reports?
Per started cycle, per retrieval and per transfer, each shown with n and a 95% confidence interval so small numbers are never oversold. Report data is hosted in India and exportable any time; see data security.
Data+Can reports be broken down by age band, protocol and doctor?
Yes. Every rate can be cut by age band, protocol, doctor, embryologist and centre, case-mix adjusted where that matters. Report data is hosted in India and exportable any time; see data security.
In India, encrypted in transit and at rest, with hourly backups and a yearly audit. Report data is hosted in India and exportable any time; see data security.
Yes. Every report exports to Excel and PDF, and the warehouse is open to Power BI and Looker on Advanced. Report data is hosted in India and exportable any time; see data security.
Data+Is the data behind a dashboard number traceable?
Yes. Click any figure and the cycles behind it are listed, so a success rate can be checked couple by couple. Report data is hosted in India and exportable any time; see data security.
Live. A result saved in the lab or a payment at the desk shows on the board within a minute. Report data is hosted in India and exportable any time; see data security.
You do. A full export of records and reports in open formats on request, no fee. Report data is hosted in India and exportable any time; see data security.
Forms 8 to 14 and the registers the Act requires, generated from the record and filed to the registry with the audit trail attached. The ART Act guide shows what inspectors check and where it lives in the reports.
Compliance+Do dashboards and reports work across branches and chains?
Yes. Each centre sees its own board and the group sees consolidated rates and finances, with centre-level permissions. The ART Act guide shows what inspectors check and where it lives in the reports.
Compliance+Can we publish success rates on our website in line with the ART Act?
Yes. The age-band and per-transfer rates export with n, so published figures match the registry and are defensible. The ART Act guide shows what inspectors check and where it lives in the reports.
Yes. Registers, forms, lab QC logs and the audit trail for any date range export as one bundle in a click. The ART Act guide shows what inspectors check and where it lives in the reports.
Yes. Who ran what, when and what was exported is logged, as the DPDP Act and the ART Rules expect. The ART Act guide shows what inspectors check and where it lives in the reports.
Yes. Generated from the year's cycles with validation, so it reconciles with the monthly registry submissions. The ART Act guide shows what inspectors check and where it lives in the reports.
Compliance+Does the lab KPI report follow the Vienna consensus?
Yes. Fertilisation, cleavage, blastocyst and utilisation rates are shown against the Vienna benchmarks and your own targets. The ART Act guide shows what inspectors check and where it lives in the reports.
Compliance+Are patient identities protected in reports?
Yes. Reports use coded identifiers; names appear only to users with record access, and donor data stays coded. The ART Act guide shows what inspectors check and where it lives in the reports.
Compliance+Who keeps the registry formats current?
Our regulatory analyst updates the registry and ICMR templates after every notification, with no action from you. The ART Act guide shows what inspectors check and where it lives in the reports.
Training+How long does a director need to learn the dashboard?
About twenty minutes. The board shows cycles, CPR, cancellations and collections on one screen, with drill-down by click. Start with the role videos or the Help Center.
Training+Is there training on reading success rates?
Yes. A short session on denominators, confidence intervals and age bands so the whole team quotes rates the same way. Start with the role videos or the Help Center.
Integrations+How do scheduled report packs reach the director?
Weekly and monthly packs go out by email and WhatsApp as PDFs, and the daily KPI summary arrives on WhatsApp each morning. Connectors and endpoints are documented in the API documentation.
Integrations+Does it connect to Power BI and Looker?
Yes. Advanced plans open the reporting warehouse to Power BI and Looker with ready-made connectors. Connectors and endpoints are documented in the API documentation.
Integrations+Do lab results feed the KPI report automatically?
Yes. Fertilisation, cleavage and blastocyst outcomes recorded in the lab module update the KPI report as they are saved. Connectors and endpoints are documented in the API documentation.
Integrations+Do collections from billing show on the dashboard?
Yes. Receipts, dues and TPA settlements from the billing module post to the finance tiles within a minute. Connectors and endpoints are documented in the API documentation.
Integrations+Can registry reports upload to the portal directly?
Yes. Validated National ART Registry and ICMR files upload to the portal in one click. Connectors and endpoints are documented in the API documentation.
Integrations+Does it sync finance reports with Tally?
Yes. Collections and P&L reconcile against Tally and Zoho Books through the billing sync. Connectors and endpoints are documented in the API documentation.
Integrations+Can a hospital HIS consume our reports?
Yes. FHIR and HL7 interfaces expose encounter, result and finance data for hospital reporting. Connectors and endpoints are documented in the API documentation.
Yes. REST endpoints for cycles, outcomes, KPIs and finance aggregates, documented publicly. Connectors and endpoints are documented in the API documentation.
Integrations+Can benchmarks come from external registries?
Yes. ICMR and international registry benchmark lines are maintained by us and appear on the relevant charts. Connectors and endpoints are documented in the API documentation.
Cycles started, clinical pregnancy rate, cancellations, collections and enquiry-to-pregnancy conversion, for the clinic or one doctor. See the dashboard on your own numbers in a 45-minute demo, or try the success-rate calculator.
Forty clinical, lab and finance reports: success rates, lab KPIs, doctor and embryologist scorecards, conversion, collections and more. See the dashboard on your own numbers in a 45-minute demo, or try the success-rate calculator.
Yes. The custom report builder on Advanced lets you pick fields, filters and groupings and save the report to a schedule. See the dashboard on your own numbers in a 45-minute demo, or try the success-rate calculator.
Product+Are there doctor and embryologist scorecards?
Yes. Case-mix adjusted scorecards so a doctor who takes harder cases is compared fairly. See the dashboard on your own numbers in a 45-minute demo, or try the success-rate calculator.
Product+Does it show enquiry-to-pregnancy conversion?
Yes. From first enquiry through consult, cycle start and outcome, with drop-off at each step. See the dashboard on your own numbers in a 45-minute demo, or try the success-rate calculator.
Product+Can the director get reports on the phone?
Yes. The dashboard works on any phone, and the daily summary arrives on WhatsApp. See the dashboard on your own numbers in a 45-minute demo, or try the success-rate calculator.
Yes. ICMR and international benchmark lines sit on the success-rate and lab KPI charts beside your own targets. See the dashboard on your own numbers in a 45-minute demo, or try the success-rate calculator.
It is included at every plan, ₹1,300 to ₹1,700 a login a month plus GST. Custom reports and BI connectors come with Advanced. See the dashboard on your own numbers in a 45-minute demo, or try the success-rate calculator.
Product+Can we see the dashboards before we commit?
Yes. A 45-minute demo on your own numbers, then the 14-day trial with historic import. See the dashboard on your own numbers in a 45-minute demo, or try the success-rate calculator.
Tell us your clinic type and how you publish success rates. We will show you your dashboards, age-band rates and registry reports configured for your clinic.